► Full UK new-car sales figures
► Who bought what in 2019
► Analysis of SMMT data
Britons bought fewer new cars in 2019 than at any point since the post-recession low of 2013, new figures out today reveal. New car sales fell by -2.3% to 2.3 million units as buyers stayed away from showrooms, according to the Society of Motor Manufacturers and Traders (SMMT).
It’s the third year of decline on the trot, following on from two record sales years in 2015 and 2016. Since then, economic uncertainty, worries over Brexit and the public’s confusion over diesel policy, taxation and the global outlook have all conspired to dent new car sales, which have slumped to one of the lowest totals since the dark days of the financial crisis a decade ago.
‘It’s been another turbulent year,’ admitted Mike Hawes, the head of the SMMT. ‘Consumer confidence is weak and people are choosing to hold on to their existing cars for longer.’
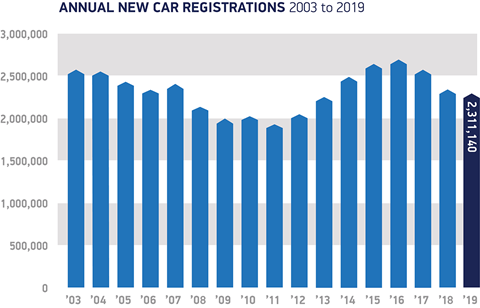
It’s likely to get worse before it gets better; analysts at the SMMT predict that 2020 will fall by a further -1.6% to around 2.27m registrations. That forecast could slump further in the event of a chaotic Brexit, but Hawes hopes that automotive prospects will improve if a tariff-free, automotive-friendly deal is struck as the UK exits from the European Union.
The car industry and Brexit
Trend-spotting: which cars we bought in 2019
The full SMMT figures seen by CAR magazine show that private car sales to individuals bore the brunt of last year’s slowdown, falling -3% (fleet sales of company cars actually rose +1%). The bestselling cars of 2019 were:
- Ford Fiesta 77,833
- VW Golf 58,994
- Ford Focus 56,619
- Vauxhall Corsa 54,239
- Mercedes A-Class 53,724
- Nissan Qashqai 55,532
- Ford Kuga 41,671
- Mini hatchback 41,188
- VW Polo 37,453
- Kia Sportage 34,502
That’s exactly the same top 10 as last year, just in a slightly jumbled order. Hats off, in particular, to the strong performances by the Golf and Corsa, both on run-out and due for replacement imminently.

When you scratch below the surface, you see some interesting changes in the type of car people are buying. Every segment shrank except two: Brits bought more SUVs (+12%) than the year before – and more sports cars, too (up +19%). By comparison, the two small car sectors that account for 57% of total sales slipped backwards by -6% for superminis (eg Ford Fiesta, Vauxhall Corsa) and -4% for small hatches (eg VW Golf, Renault Megane). Small cars are falling out of favour, it seems.
It’s ironic that Brits are buying fewer of the types of car that are inherently cleaner – while rushing towards bigger, heavier, more polluting cars. The fleet average of all new cars sold in 2019 rose for the third year running: up +2.7% to 127.9g/km of CO2. The SMMT blames the tougher WLTP testing regime, falling diesel sales and segment shift, as buyers prefer bigger, thirstier cars.
It means we’re on a collision course with the tough Europe-wide 95g/km CO2 target – and accompanying draconian fines – due to come into force by 2021. Click here for our explainer on the CO2 time bomb – the UK is sticking with this target even after its divorce from the EU.
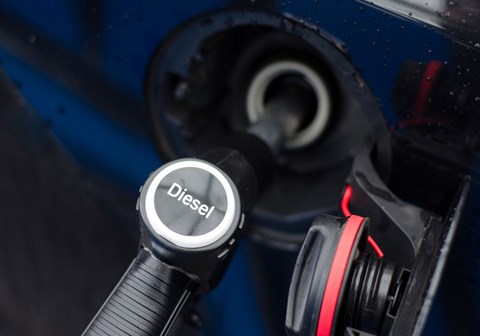
Diesel down, petrol – and electric cars – up
The Volkswagen diesel emissions cheating scandal has ripped up the rulebook for so many car makers; sales of diesel cars in Great Britain collapsed last year by a further -21.8% compared with 2018, and just 583,000 oil-burners were registered in the full year. The market share of diesels was barely more than a quarter of all sales; it wasn’t long ago that well over half of all cars sold in the UK drank from the black pump.
Should you still buy a diesel car?
To put that in context, Brits lapped up 1.49m petrol-powered cars, up +2.3% year-on-year. The big winner was what the SMMT calls alternatively fuelled vehicles (AFVs), which rose in popularity by +20% last year:
Hybrids +17% to 97,850 units (4% market share)
- Battery electric vehicles +144% to 37,850 units (1.6% market share)
- Plug-in hybrid electric vehicles (PHEVs) -17.8% to 34,734 units (1.5% market share)
- Mild-hybrid petrol +172% to 26,361 (1.1% market share)
- Mild-hybrid diesel +740% to 32,217 (1.4% market share)
The fall in popularity of PHEVs has been driven by the removal of the Plug In Car Grant for plug-in vehicles, warns the SMMT. Demand peaked at 1.8% of the total market in 2018, but their extra cost appears to be deterring buyers.
Our guide to the best plug-in and hybrid cars
‘There are around 50 plug-in models to choose from today, but that is about to increase by 34 in 2020,’ said Hawes, ‘and around 160 more in 2021. With the Plug In Car Grant expiring this March, it’s imperative that the Government steps in to subsidise these new technologies to drive consumer demand.’
Winners and losers: Britain’s new car registrations 2019 in full
Brands with genuine increases were few and far between. Boardrooms celebrating included:
- Alpine Proper supply of A110 pushed sales up +20%
- Dacia Ongoing popularity of austerity-spec value cars drove +28% growth
- Lexus Hybrid strategy pays off, plus new UX crossover helped +27% leap
- MG Another value proposition and popular SUV posted a +44% increase
- Porsche Pent-up demand for new 992 contributed to a stout +23% jump
- Seat SUVs, new product, cheaper-than-VW prices all helped towards a +9% performance
- Volvo Ongoing sweet spot of stylish, slick, Scandinavian SUVs boosted sales +12%
Brands suffering double-digit percentage falls include:
- Abarth Appetite for small pocket rockets slumped by -39% last year
- Alfa Romeo Fiat Chrysler generally had a poor year; Alfa’s sportier offerings slipped -18%
- DS French luxo brand sales nearly halved last year – fell another -15% in 2019
- Fiat Italian mothership suffered a -16% fall, as over-reliance on 500 range bit
- Honda Japanese brand’s narrow product portfolio led to a -17% fall in sale
- Infiniti An unsurprising -61% collapse, after brand announced exit from European sales
- Maserati Sales fell by more than a quarter, as upmarket Italian execs and SUVs dwindled
- Mitsubishi Worrying -23% fall, as ageing product line-up failed to attract buyers
- Smart Diminutive city car range struggled, with sales nearly halving as switch to EVs arrived
- Ssangyong Sales fell by a third, with just 1930 vehicles registered in 2019
The full breakdown of brands’ performance is below. Tip to smartphone readers: swivel your device landscape to fit in the full table!
| MARQUE |
2019 SALES |
% MARKET SHARE |
2018 SALES |
% MARKET SHARE |
UP OR DOWN? |
| Abarth |
3448 |
0.15% |
5631 |
0.24% |
-38.8% |
| Alfa Romeo |
3413 |
0.15% |
4161 |
0.18% |
-18.0% |
| Alpine |
171 |
0.01% |
142 |
0.01% |
+20.4% |
| Audi |
138,924 |
6.01% |
143,739 |
6.07% |
-3.4% |
| Bentley |
1595 |
0.07% |
1542 |
0.07% |
+3.4% |
| BMW |
169,753 |
7.34% |
172,048 |
7.27% |
-1.3% |
| Chevrolet |
62 |
0.00% |
41 |
0.00% |
+51.2% |
| Citroen |
50,806 |
2.20% |
49,618 |
2.10% |
+2.4% |
| Dacia |
30,951 |
1.34% |
24,169 |
1.02% |
+28.1% |
| DS |
4299 |
0.19% |
5074 |
0.21% |
-15.3% |
| Fiat |
29,890 |
1.29% |
35,652 |
1.51% |
-16.2% |
| Ford |
236,137 |
10.22% |
254,082 |
10.73% |
-7.1% |
| Honda |
43,913 |
1.90% |
52,570 |
2.22% |
-16.5% |
| Hyundai |
83,284 |
3.60% |
89,925 |
3.80% |
-7.4% |
| Infiniti |
292 |
0.01% |
750 |
0.03% |
-61.1% |
| Jaguar |
36,069 |
1.56% |
37,019 |
1.56% |
-2.6% |
| Jeep |
6193 |
0.27% |
6114 |
0.26% |
+1.3% |
| Kia |
97,323 |
4.21% |
95,764 |
4.05% |
+1.6% |
| Land Rover |
76,546 |
3.31% |
77,906 |
3.29% |
-1.8% |
| Lexus |
15,713 |
0.68% |
12,405 |
0.52% |
+26.7% |
| Lotus |
225 |
0.01% |
247 |
0.01% |
-8.9% |
| Maserati |
933 |
0.04% |
1297 |
0.05% |
-28.1% |
| Mazda |
40,148 |
1.74% |
39,602 |
1.67% |
+1.4% |
| Mercedes-Benz |
171,823 |
7.43% |
172,238 |
7.28% |
-0.2% |
| MG |
13,075 |
0.57% |
9049 |
0.38% |
+44.5% |
| Mini |
64,884 |
2.81% |
67,021 |
2.83% |
-3.2% |
| Mitsubishi |
16,199 |
0.70% |
21,156 |
0.89% |
-23.4% |
| Nissan |
92,372 |
4.00% |
102,637 |
4.34% |
-10.0% |
| Peugeot |
80,851 |
3.50% |
81,043 |
3.42% |
-0.2% |
| Porsche |
15,257 |
0.66% |
12,437 |
0.53% |
+22.7% |
| Renault |
59,132 |
2.56% |
62,168 |
2.63% |
-4.9% |
| Seat |
68,798 |
2.98% |
62,863 |
2.66% |
+9.4% |
| Skoda |
75,053 |
3.25% |
74,724 |
3.16% |
+0.4% |
| Smart |
4022 |
0.17% |
7631 |
0.32% |
-47.3% |
| Ssangyong |
1930 |
0.08% |
2754 |
0.12% |
-29.9% |
| Subaru |
2997 |
0.13% |
3141 |
0.13% |
-4.6% |
| Suzuki |
35,065 |
1.52% |
38,519 |
1.63% |
-9.0% |
| Toyota |
105,192 |
4.55% |
101,922 |
4.31% |
+3.2% |
| Vauxhall |
159,830 |
6.92% |
177,298 |
7.49% |
-9.9% |
| Volkswagen |
200,771 |
8.69% |
203,133 |
8.58% |
-1.2% |
| Volvo |
56,208 |
2.43% |
50,319 |
2.13% |
+11.7% |
| Other British |
2958 |
0.13% |
2804 |
0.12% |
+5.5% |
| Other imports |
14,635 |
0.63% |
4792 |
0.20% |
+205.4% |
| Total |
2,311,140 |
100% |
2,367,147 |
100% |
-2.4% |
Changing trends: a look back at the past few years UK new-car sales figures
UK car sales 2018
UK car sales 2017