► UK car sales hit new record
► More than 2.6m new cars sold
► Full analysis: who’s up, who’s down
Brits bought more cars than ever before in 2015, as a new sales record was set. More than 2.6 million new cars were sold, up 6% on 2014. It’s only the fourth time ever that the UK market has surpassed 2.5m.
The new figures, published by the Society of Motor Manufacturers and Traders (SMMT), confirm that showrooms are awash with buyers as the economy grows, punters have more money in their pockets and manufacturers offer tempting incentives, discounts and deals.
‘Consumer confidence is very high – the highest since the recession thanks to wage growth, low interest rates and reduced fuel prices,’ said SMMT chief Mike Hawes.
Forty-three of the past 45 months have seen consecutive growth; only October and November 2015 dipped, but the year ended with a strong December, enjoying 8% growth. But don’t go popping too many champagne corks; although no official figures are available yet, there is also evidence that pre-registration is rife among dealers…
Britain’s best-selling cars revealed
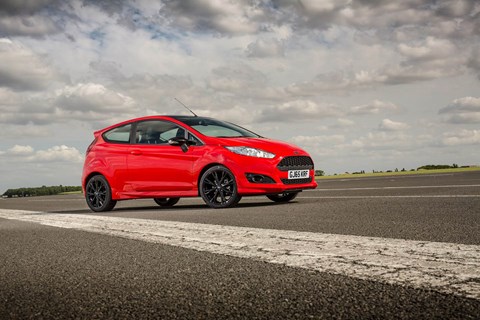
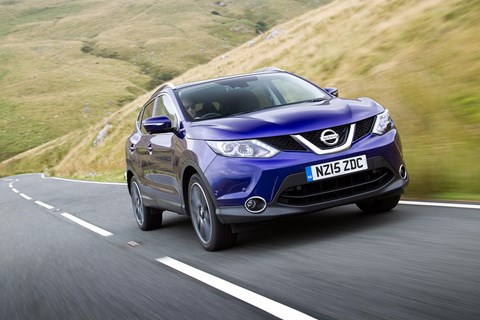
The Ford Fiesta was once again crowned Britain’s most popular car, selling more than 100,000 units. The supermini is ageing well; it’s topped the sales charts every year this decade. It was followed – not that closely – by the Corsa, Focus, Golf and Qashqai.

The top 10 sellers in full:
1) Ford Fiesta 133,434
2) Vauxhall Corsa 92,077
3) Ford Focus 83,816
4) Volkswagen Golf 73,409
5) Nissan Qashqai 60,814
6) Volkswagen Polo 54,900
7) Vauxhall Astra 52,703
8) Audi A3 47,653
9) Mini 47,076
10) Vauxhall Mokka 45,399
Did #Dieselgate affect UK car sales?
The VW emissions scandal doesn’t appear to have affected the popularity of diesel too much in Britain. The fuel continues to prove popular and 48.3% of all new cars registered were diesel, compared with 48.8% petrol.
‘While there has been a lot of comment and concern over diesels and air quality, buyers still value good fuel economy and in most instances diesels offer this – relatively few people drive exclusively in urban areas,’ said Hawes. ‘Diesel also has an important role to play in achieving the UK’s climate change targets.
‘Given what happened in October and November, VW were looking to hit back and they had a good December. There’s no evidence to suggest a significant impact [from Dieselgate] on VW further down the line.’ It’s proven in the figures: VW sales grew 4% and both Golf and Polo were in the top 10, although only because of gains earlier in the year. Since the scandal, they’ve slumped…
Other trends in the UK marketplace
The figures published by the SMMT reveal further interesting nuggets about buyer behaviour:
- Shift towards premium Average transaction prices up from £21,000 in 2014 to £22k in 2015
- Hybrids become more popular Hybrids/EVs growing, but still account for just 3% of sales: 78,000 in 2015
- 4×4 love-in continues Crossovers remain the segment showing biggest growth
- Most purchases are financed It’s all borrowed: 80% of purchases are on finance – most on PCP deals
- Farewell, niche brands No Peroduas or MIAs were sold; only 137 Chryslers and 12 leftover Chevrolets…
- Fleets still strong 1.3m cars – precisely half the market – were bought by businesses
Who’s up, who’s down: UK car manufacturers sales in 2015 in full
Reasons for cheer could be heard at BMW (regaining their #1 premium status ahead of Audi, Mercedes and Jaguar); SsangYong doubling their UK sales; Infiniti growing even before the Q30 hatch arrives; Jag up by nearly a third, the new XE and XF paving the way for the 2016 F-Pace; the smaller Jeeps powered the US brand to a 176% leap; Mitsubishi enjoyed a huge 40% increase, driven by its Outlander PHEV; and Porsche now sells five-figures in the UK, nearly as many as Lexus.
Anyone whose sales shrunk in a booming market has had a bad year: Alfa (down 8%) is waiting for the new Giulia; Fiat dipped 4%, Seat was down a worrying 11% and Skoda – another emissions crisis casualty – suffered a more modest 1% slip. A surprise fall, too, for Suzuki, down 8%.
| MARQUE |
2015 sales |
% Market share |
2014 sales |
% Market share |
Up or down? |
| Abarth |
2743 |
0.10 |
1642 |
0.07 |
+67.1% |
| Alfa Romeo |
5069 |
0.19 |
5523 |
0.22 |
-8.2% |
| Aston Martin |
949 |
0.04 |
864 |
0.03 |
+9.8% |
| Audi |
166,709 |
6.33 |
158,987 |
6.42 |
+4.9 |
| Bentley |
1379 |
0.05 |
1472 |
0.06 |
-6.3% |
| BMW |
167,391 |
6.36 |
148,878 |
6.01 |
+12.4% |
| Chevrolet |
12 |
0.00 |
2774 |
0.11 |
-99.6% |
| Chrysler |
137 |
0.01 |
1982 |
0.08 |
-93.1% |
| Citroen* |
80,012 |
3.04 |
83,397 |
3.37 |
-4.1% |
| Dacia |
26,228 |
1.00 |
23,862 |
0.96 |
+9.9% |
| DS* |
8614 |
0.33 |
0 |
0.00 |
0.00 |
| Fiat |
64,257 |
2.44 |
67,162 |
2.71 |
-4.3% |
| Ford |
335,267 |
12.73 |
326,643 |
13.19 |
+2.6% |
| Honda |
53,417 |
2.03 |
53,544 |
2.16 |
-0.2% |
| Hyundai |
88,117 |
3.35 |
81,986 |
3.31 |
+7.5 |
| Infiniti |
1195 |
0.05 |
746 |
0.03 |
+60.2 |
| Jaguar |
23,954 |
0.91 |
18,401 |
0.74 |
+30.2% |
| Jeep |
10,794 |
0.41 |
3909 |
0.16 |
+176.1% |
| Kia |
78,489 |
2.98 |
77,525 |
3.13 |
+1.2% |
| Land Rover |
66,574 |
2.53 |
56,200 |
2.27 |
+18.5% |
| Lexus |
13,269 |
0.50 |
11,572 |
0.47 |
+14.7% |
| Lotus |
375 |
0.01 |
235 |
0.01 |
+59.6% |
| Maserati |
1434 |
0.05 |
1194 |
0.05 |
+20.1% |
| Mazda |
45,504 |
1.73 |
37,784 |
1.53 |
+20.4% |
| Mercedes-Benz |
145,254 |
5.52 |
124,419 |
5.02 |
+16.8% |
| MG |
3152 |
0.12 |
2326 |
0.09 |
+35.5% |
| Mia |
0 |
0.00 |
5 |
0.00 |
-100.0% |
| Mini |
63,581 |
2.41 |
53,661 |
2.17 |
+18.5% |
| Mitsubishi |
22,693 |
0.86 |
15,805 |
0.64 |
+43.6% |
| Nissan |
153,937 |
5.85 |
138,338 |
5.59 |
+11.3% |
| Perodua |
0 |
0.00 |
29 |
0.00 |
-100.0% |
| Peugeot |
104,249 |
3.96 |
103,566 |
4.18 |
+0.7% |
| Porsche |
12,167 |
0.46 |
9160 |
0.37 |
+32.8% |
| Proton |
0 |
0.00 |
11 |
0.00 |
-100% |
| Renault |
75,618 |
2.87 |
66,334 |
2.68 |
+14.0% |
| Saab |
0 |
0.00 |
3 |
0.00 |
-100.0% |
| Seat |
47,654 |
1.81 |
53,512 |
2.16 |
-11.0% |
| Skoda |
74,692 |
2.84 |
75,488 |
3.05 |
-1.1% |
| Smart |
8455 |
0.32 |
4342 |
0.18 |
+94.7% |
| SsangYong |
3344 |
0.13 |
1542 |
0.06 |
+116.9% |
| Subaru |
3455 |
0.13 |
2793 |
0.11 |
+23.7% |
| Suzuki |
34,437 |
1.31 |
37,395 |
1.51 |
-7.9% |
| Toyota |
98,709 |
3.75 |
94,012 |
3.80 |
+5.0% |
| Vauxhall |
269,766 |
10.24 |
269,177 |
10.87 |
+0.2% |
| Volkswagen |
223,784 |
8.50 |
214,828 |
8.67 |
+4.2% |
| Volvo |
43,432 |
1.65 |
41,066 |
1.66 |
+5.8% |
| Other British |
701 |
0.03 |
774 |
0.03 |
-9.4% |
| Other imports |
2534 |
0.10 |
1567 |
0.06 |
+61.7% |
| Total |
2,633,503 |
|
2,476,435 |
|
+6.3% |
* DS and Citroen These figures were split in May, with the creation of the separate DS sub-brand
